This inefficient system also required advisors to maintain separate spreadsheets for each client, making it a huge challenge to test various financial modeling scenarios. Without a simple way to capture varying investment scenarios across projected timelines, advisors were forced to create entirely new sheets for each customer scenario, which quickly became difficult for advisors to manage and confusing for clients to follow.
Challenges
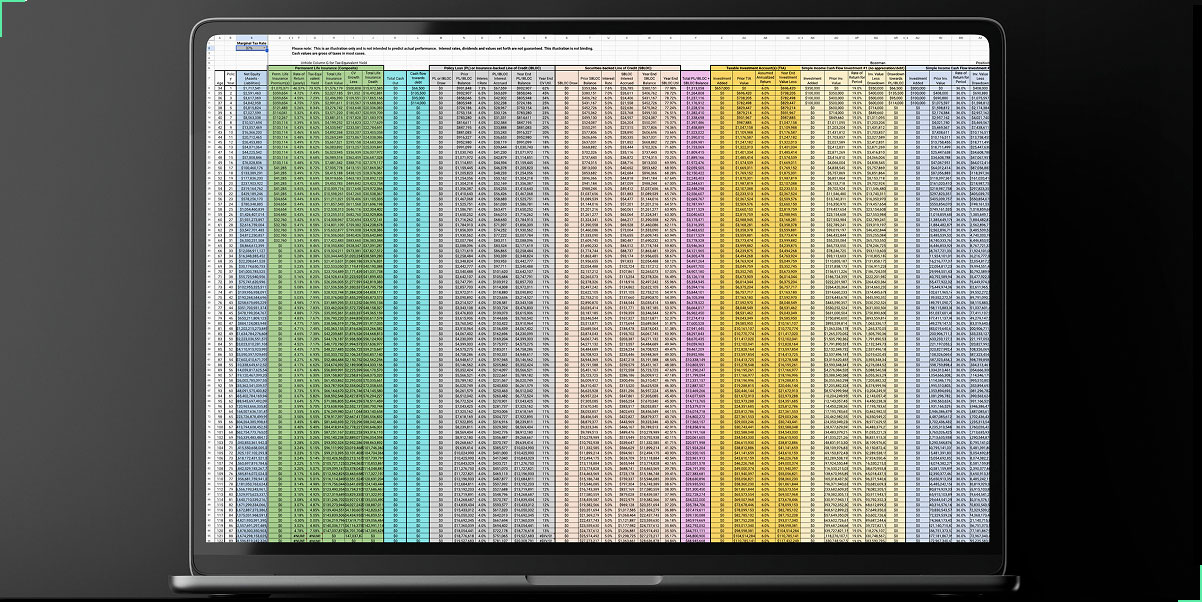
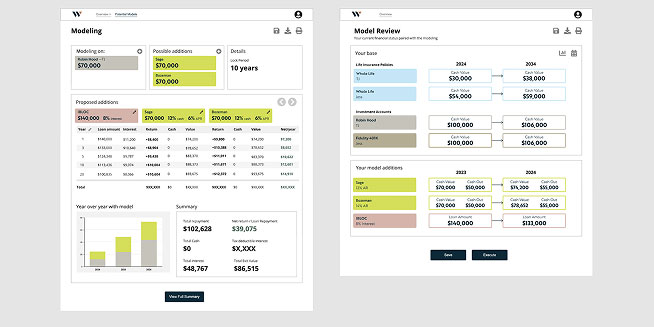
Data Translation and Visualization:
Our primary challenge was to assess how to best translate the existing method of displaying 30–50 years of detailed data in the form of overwhelming Excel spreadsheets into a more visually-forward format that was informative, accurate, and easy for customers to process — eliminating the “wall of numbers” that frequently made clients' eyes glaze over.
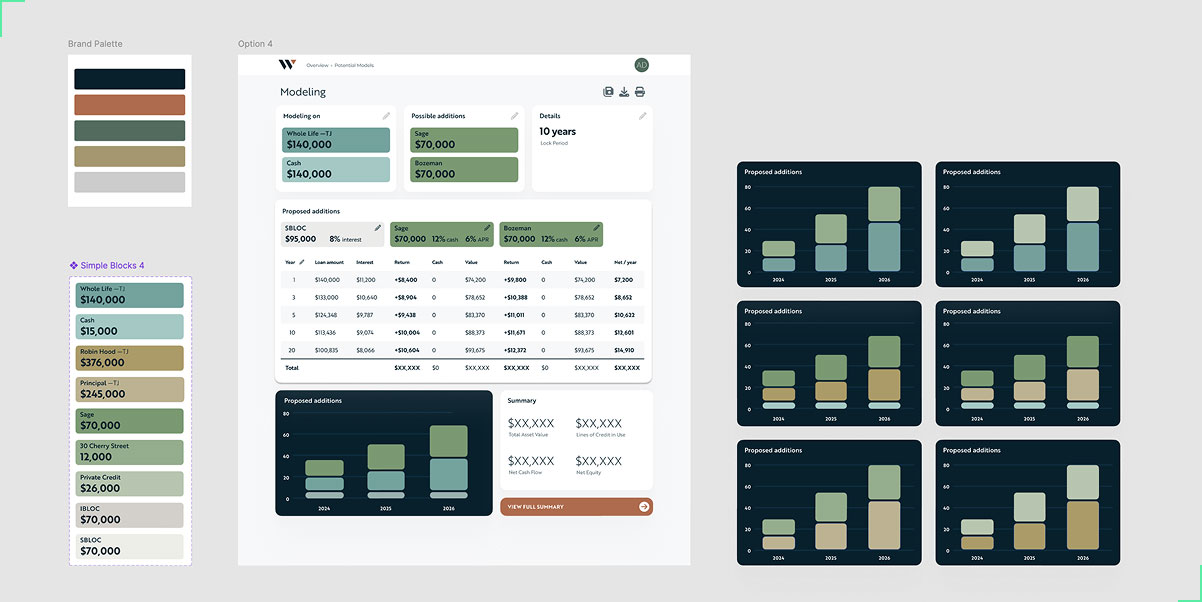
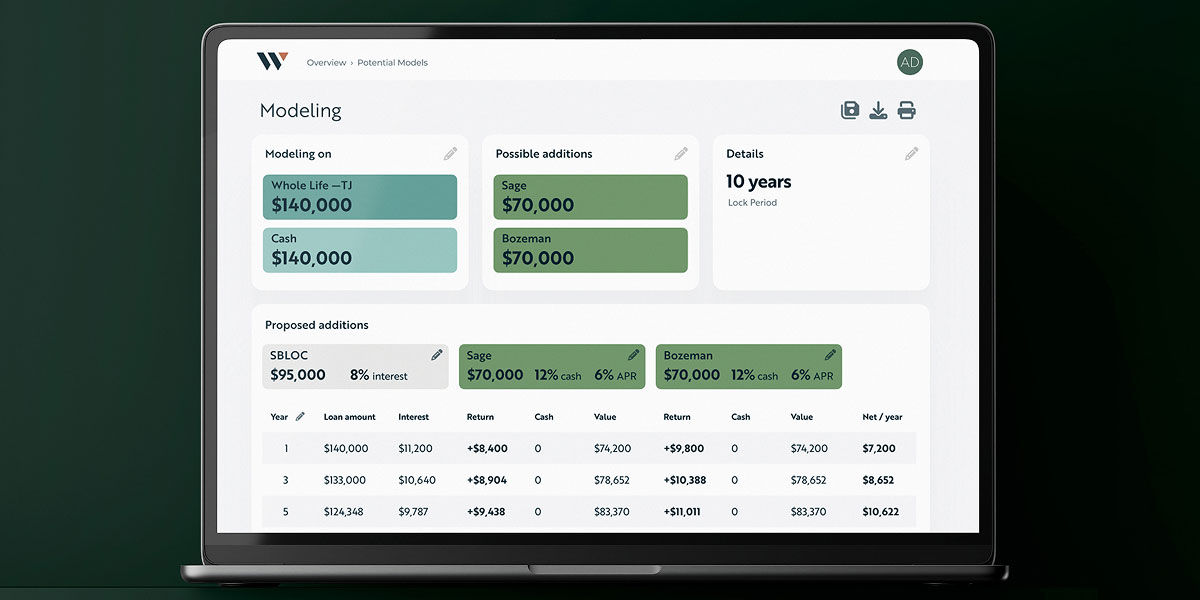
Complex Financial Modeling:
Developing accurate methods to model complex financial scenarios was critical. Key scenarios included modeling the use of debt to purchase assets, paired with inputs such as interest rates, rates of return, and cash flows.
Scenario Management and Efficiency:
The inefficient historical system required separate spreadsheets for each client. Advisors struggled to test financial modeling scenarios because they could not capture multiple time points, which forced them to create entirely new sheets for each iteration they wished to share with their clients.